Explore the InfoHub™ Dashboard
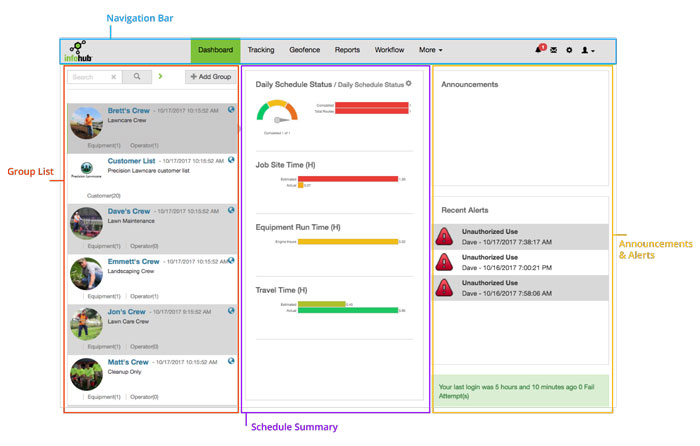
When you log into InfoHub, the Dashboard appears. The interface has the following sections:
The Navigation Bar - The area at the top of the interface, with tabs to open and move between sections of InfoHub, as well as utility links to settings, logout, and get support.
The Group List - The leftmost column holds all your crews and customers sorted into Groups. You can select a Crew group to see the schedule summary for that crew.
Schedule Summary - This section is in the very middle of the screen and shows the daily schedule details of the selected group from the Group List. You can see how many jobs are assigned for that day, equipment runtime and travel time between Job Sites.
Announcements and Alerts - On the right side of the screen are your Announcements and Alerts. Announcements may include system updates, advertisements, and it can even be customized. Ask a Support Team member how to create a custom announcement message.
Below Announcements you will see a list of recent alerts that have been generated by your equipment and crews. Select an alert from this list to be taken directly to the Tracking page where you can see more details about the crew or equipment that generated that alert.
The items in the Navigation Bar take you to major feature areas of InfoHub. No matter where you are, you can always select the InfoHub logo in the Navigation Bar to return to the Dashboard.
Label |
Description |
Dashboard |
The Dashboard is the main central of InfoHub. The Dashboard gives you an overview of your crews & their daily schedules and any current announcements or alerts from equipment. |
Tracking |
In Tracking, you can see all your crews, customers and equipment on a map. Tracking also allows you to see history of a crew member to replay their daily routes, job site destinations, mowing patterns and travel efficiency. |
Geofence |
Display, assign and create Geofences. Use geofences to know when equipment enters and leaves your offices, protect against theft and ensure that operators are staying on task. Geofences act independent of job sites. |
Reports |
InfoHub’s reporting component lets you generate and view reports about your operations data on demand and even schedule them to be delivered to you on a recurring basis. See about the types of reports you can create. |
Workflow |
Build work schedules and routes for your crew members in Workflow. Arrange Job Sites in a route to minimize travel time and assign crews to complete the work. |
Utility Menu Icons
This menu appears at the upper right side of the Navigation Bar.
Icon |
Task |
Alerts: Shows a list of currently active alerts. As a manager, you can review active alerts and acknowledge any that require attention. |
|
Tools & Settings: Here you can access additional options for your InfoHub account such as creating proposal templates and importing data. InfoHub Support articles, documentation and videos are also located here. |
|
User Admin: Log out of InfoHub and change your password. |
The panel to the left of the main content window in the Dashboard is your Group Lists. “Groups” in InfoHub are card-based collections of your business. There are two types:
Crews: Crew groups include your Telematic Tracking enabled equipment as well as your employees, called “operators”.
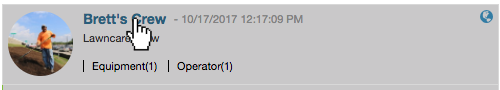
- You can see the number of operators and equipment have been assigned to a crew by the labels in that group’s card.
- To see the Schedule Summary for a Crew, select anywhere in card of that group. When you want to see details or edit information about the group, select the name. Your cursor will switch to a pointer.
Customers: A Customer Group includes multiple business accounts that you provide service as well as the individual Job Sites within those accounts.
- You can see how many customer accounts are in your Customer Group by the labels in that group’s card.
- We recommend that clients use a single Customer Group for all their customers. If your business is large enough that you have multiple office locations or service areas, you might consider using a Customer Group to associate with these locations.
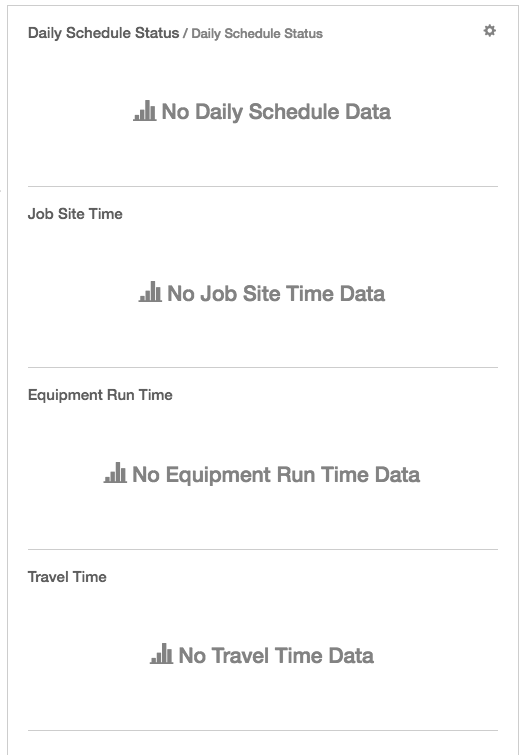
The schedule summary appears in the middle of the main content window. Depending on which Crew is selected, you will see details about that crew’s daily work schedule.
If you have selected your Customer Group, this center column will appear blank as shown.
Graph Descriptions
The schedule summary appears in the middle of the main content window. Depending on which Crew is selected, you will see details about that crew’s daily work schedule.
If you have selected your Customer Group, this center column will appear blank as shown.
Graph Descriptions
The most common information within the schedule summary column includes the following:
Daily Schedule Status: Today’s total routes for this crew along with the progress to completion.
Job Site Time: The estimated time it will take to complete today’s routes (based on your Job Site Mapping) vs the actual that your crew is on site.
Equipment Run Time: Indicates the total time, in hours, that the equipment has been running.
Travel Time: Compares the estimated and actual time it will take to travel between today’s routes (based on your Workflow Route).
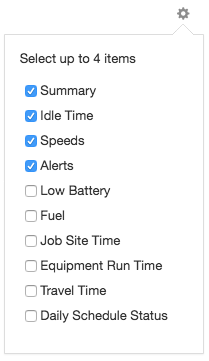
Note: There are additional graphs that can be displayed within schedule summary. You can select up to 4 items to display at a time. To customize which graphs to display, select the gear icon in the center of the dashboard